The Dark Query Problem: What Search Console Leaves Out
Understand the gap between Search Console totals and query rows, then use ranking and landing-page data to identify topics worth investigating.
In this guide
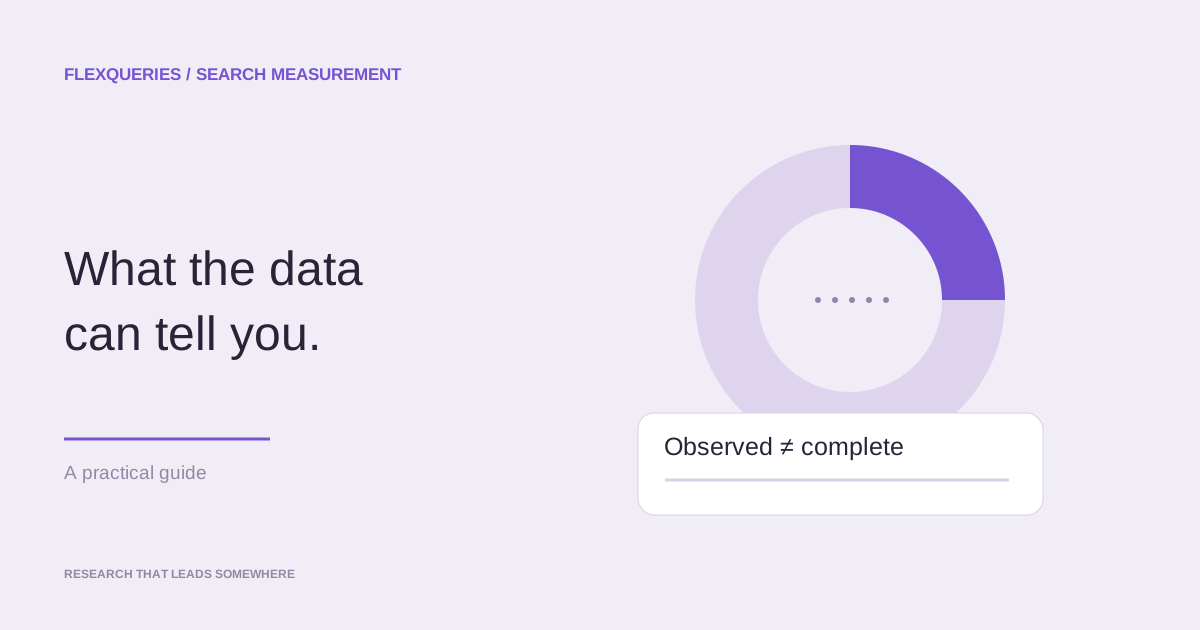
A page can show 100 clicks in Google Search Console while its visible query rows account for only 14 clicks. That is an example, not a typical percentage. The number of query rows and the number of clicks are different measurements: one query can generate many clicks.
Some searches are withheld for privacy. These are often called dark queries. Query filters, reporting limits, and aggregation differences can also affect the gap between a chart total and a table. Google explains how Search Console handles anonymized queries and totals.
You cannot recover the exact hidden searches through another tool. You can investigate which topics a page ranks for and which deserve more attention. FlexQueries MCP connects Search Console and paid keyword, ranking, and SERP research for that work. New to the workflow? Start with the SEO coach.
Compare clicks with clicks
For one page, use the same dates, search type, and filters when comparing total clicks with the sum of clicks in named query rows. Check whether the export or API response is truncated before attributing the entire difference to anonymization.
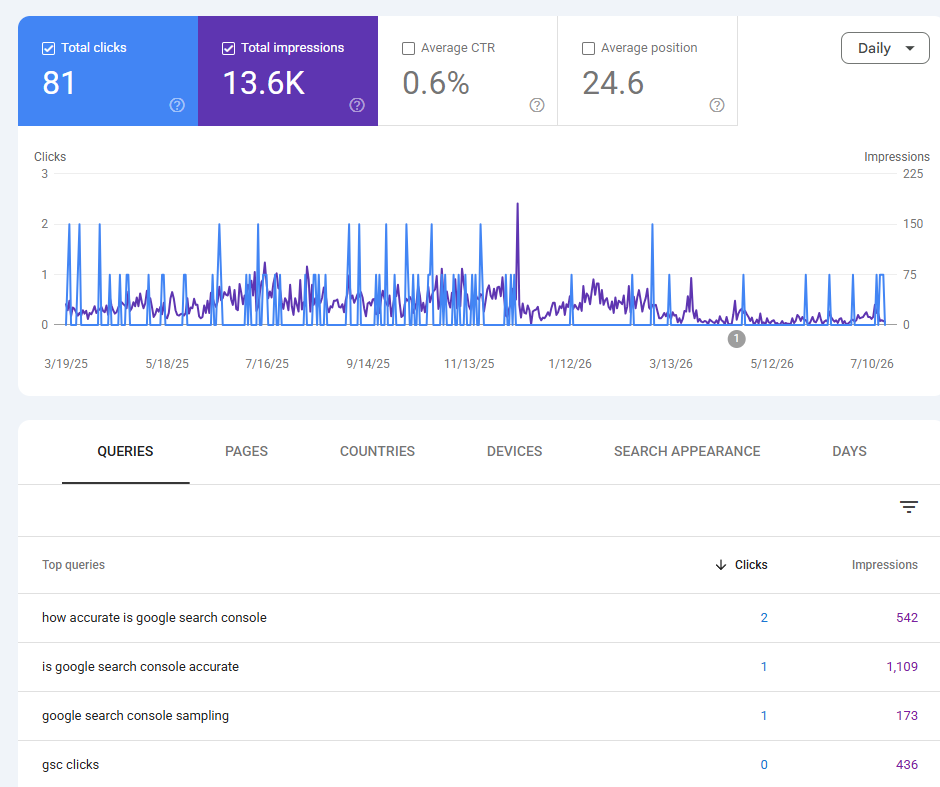
A short visible table alone does not establish how much traffic is hidden. Its query rows may each account for multiple clicks, and more rows may be available beyond those shown. Keep the measured gap separate from an explanation of why it exists.
AI referrals leave a different gap
AI-assisted discovery can be difficult to attribute too. A visitor may follow a link from an AI answer, copy the URL, or search for the brand later. Some journeys retain referral information; others do not. Search Console does not provide a complete record of those journeys.
A brand mention in an AI response does not prove a visit or a conversion. Treat mention research as visibility evidence and use your analytics to investigate traffic separately.
Calculate the gap without naming its cause
Consider one page over a fixed 28-day period. Its unfiltered page total shows 100 clicks. After checking pagination and keeping the same search type and dates, the named query rows sum to 45 clicks. The measured difference is 55 clicks.
| Measurement | Example value | What it establishes |
|---|---|---|
| Page-level clicks | 100 | The reported click total for the selected page and scope. |
| Clicks in returned named-query rows | 45 | Clicks attached to the query rows you can inspect. |
| Difference | 55 | A gap requiring explanation, not 55 recovered queries. |
The difference is 55% of the page total in this fictional example. That calculation still does not tell you the missing phrases, how many distinct queries they represent, or how much of the gap is attributable to privacy filtering rather than reporting limits.
Be especially careful with query filters. A filter that includes or excludes named queries can change the population behind a chart total. Save the report settings or export alongside the calculation, including any row limits. Otherwise two apparently similar screenshots may describe different scopes.
You can repeat this calculation for important pages and date ranges. Use it to assess how incomplete a query-level explanation may be, not to create a universal "dark query percentage" for the site.
Use three sources carefully
Three views of a page can help you choose what to investigate:
- Search Console: observed clicks, impressions, CTR, and average position for the queries Google reports.
- Ranking and keyword research: independently observed rankings and related terms that may be relevant to the page.
- Landing-page analytics: measured sessions, engagement, and conversions, subject to consent, attribution, and tracking limits.
Sessions and Search Console clicks are not interchangeable. A difference between them does not identify missing queries. Similarly, a keyword ranking on page one is a research candidate, not proof that it generated any of the withheld clicks.
Do it with FlexQueries
1. Read the reported search performance
Connect your Search Console property in FlexQueries. Ask your agent for the page's total clicks and the sum of available named-query clicks, keeping the scope consistent. Have it disclose pagination and filtering limits.
2. Expand the topic list
Use ranked-keyword and keyword-research tools to find related terms and observed rankings for the URL. Compare those with the visible Search Console queries. The keyword research skill can help organize a repeatable process.
Search Console calls have no FlexQueries usage charge. Keyword and ranking research use your pay-as-you-go balance.
3. Add landing-page analytics with its scope intact
FlexQueries has a native GA4 connection in project settings. Its Web analytics report shows a 28-day overview and the top 20 landing pages, with an export option. Those totals cover the report's traffic scope; they are not automatically an organic-search-only report.
The public MCP toolset does not currently expose a general GA4 reporting tool. To give an external agent analytics context, supply a dashboard export or a separate authorized analytics integration. For this investigation, request the exact page, matching dates, and organic channel scope in GA4 when the dashboard overview is not sufficient. Your AI client or other integration may charge separately.
A prompt to investigate one page
Investigate [yourwebsite.com/page] for the last 90 days.

1. Use the connected Search Console property. Compare total clicks with
   the sum of named-query clicks for this exact URL, using consistent
   dates, search type, and filters. Paginate where available and disclose
   any remaining limits. Do not assume every missing click is anonymized.

2. Research observed ranking keywords for this exact URL, especially
   positions 1–20. Group them by intent and identify topics absent from
   the visible Search Console query set. Label these as candidates for
   investigation, not recovered queries or attributed clicks.

3. If I provide a landing-page analytics export or a separate authorized
   analytics connection, summarize organic engagement and conversions.
   Otherwise, explain which data is missing. Do not treat sessions as
   equivalent to Search Console clicks.

Return the measured findings, the hypotheses, and three content checks
I can act on. State which tool calls use paid data before running them.
The result should be a shortlist of topics to inspect, with evidence and uncertainty attached. No part of this process can tell you the exact anonymized searches or assign their clicks to inferred topics.
Turn the evidence into a content decision
Pick one important page. Check whether its visible queries match its purpose, whether related ranking topics deserve a clearer section, and whether visitors take the intended next step.
Suppose a guide to restaurant payroll has visible queries about basic setup. Independent ranking research also finds it appearing for tip reporting. Inspect the page: does it explain the reporting workflow, or mention the topic only in passing? Review the current results and ask the product or support team whether customers need that explanation.
That is a defensible reason to improve a section. "Tip reporting produced the hidden clicks" is not. Keep those statements separate in the brief you give a writer or an AI agent.
After the update, compare page-level clicks and reported query performance over a suitable period. Note publication dates, seasonal changes, and any other site changes. If the page improves, the result supports keeping useful material current; it does not retrospectively identify anonymized searches.
What to put in a client report
A concise report can contain four parts:
- Scope: exact URL, dates, search type, filters, source, and export limits.
- Observed result: page total, sum of returned named-query clicks, and their difference.
- Research candidates: related topics with the evidence that made them worth checking.
- Decision: the page change, owner, and next review date.
Avoid a chart that labels inferred topics as shares of hidden traffic. It looks precise while saying something the data cannot support. If analytics is unavailable, leave conversion conclusions out and explain which report would be needed.
This discipline also helps when agents combine tools. Ask them to preserve source labels in their working notes, distinguish estimates from observed metrics, and show the cost scope before paid research. Combining datasets makes the investigation broader; it does not erase the limits of each source.
That gives you a practical way to improve the page while respecting the limits of the data. FlexQueries brings Search Console and keyword research into the same workspace so you can repeat those checks as the page changes.
Try the workflow with your own site, then use the results to decide what deserves your attention.
Explore the SEO tools